
Pollution around Epsom and Ewell Schools


Epsom and Ewell Extinction Rebellion embark on a public education drive on Sunday 9th October in Epsom High Street. The climate action group has tabulated the pollution statistics for schools in and around the Borough.
The table below is based on statistics provided by addresspollution.org a United Nations accredited initiative of the Central Office of Public Interest.
Between 10am and 1pm the XR group will have a Doctor’s surgery (with an Intensive Care Unit Doctor) giving real world advice on the health impact of Air Pollution. A Citizens Polling Board so passersby can vote for their favourite Pollution Solutions and an information desk so you can find out the Air Pollution levels at your home and local schools.
In 2020 in a study published by the journal Science of the Total Environment, experts from the University of Surrey’s world-renowned Global Centre for Clean Air Research (GCARE) partnered with a local school and the local community in Guildford to investigate the impact cars have on air quality in and around schools during drop-off and pick-up times.
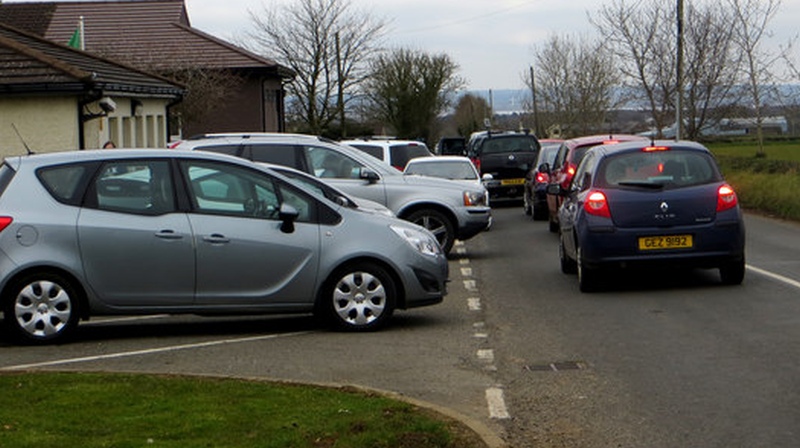
Children face a worrying threefold increase in air pollution during the daily school runs, causing air quality experts to call for restrictions on the use of cars during those periods.
These are the statistics provided by addresspollution.org for local school postcodes year long average figures assessed on 4th October 2023:
| School | A i r Pollution Level | UK Ranking Higher is worse | PM2.5 Level mcg/m3 WHO Safe Limit 5 . | PM10 Level mcg/m3 WHO Safe Limit 15 . | NO2 Level mcg/m3 WHO Safe Limit 1 0 . |
| Auriol School | Very High | 8 2 % | 12.22 | 18 .8 9 | 2 0 .1 7 |
| Beacon School | Significant | 5 1 % | 1 0 .4 0 | 1 6 .8 4 | 1 5 .1 6 |
| Blenheim High | High | 7 8 % | 1 1 .9 0 | 1 8 .6 4 | 1 9 .0 6 |
| Che a m Common | Very High | 8 4 % | 1 2 .2 8 | 1 9 .0 7 | 2 1 .5 0 |
| Cuddington Croft | High | 7 0 % | 1 1 .1 7 | 1 7 .8 0 | 1 8 .8 2 |
| Cuddington School | Very High | 8 2 % | 1 2 .1 9 | 1 8 .8 4 | 2 0 .8 4 |
| Danetree | Very High | 8 0 % | 1 2 .0 5 | 1 8 .7 1 | 1 9 .5 9 |
| Downsend | High | 7 2 % | 1 1 .4 6 | 1 8 .0 5 | 1 8 .3 1 |
| Epsom & Ewell High | Very High | 8 3 % | 1 2 .1 6 | 1 8 .8 4 | 2 1 .2 2 |
| Epsom College | High | 6 4 % | 1 0 .9 6 | 1 7 .5 2 | 1 7 .0 5 |
| Epsom Downs Primary | Significant | 5 2 % | 1 0 .3 8 | 1 6 .9 2 | 1 5 .3 8 |
| Epsom Primary | High | 7 8 % | 1 1 .7 7 | 1 8 .4 1 | 1 9 .8 2 |
| Ewell Castle | High | 7 8 % | 1 1 .7 9 | 1 8 .4 9 | 1 9 .8 7 |
| Ewell Grove | Very High | 8 2 % | 1 2 .0 1 | 1 9 .0 2 | 2 1 .0 2 |
| Glyn | High | 7 4 % | 1 1 .6 9 | 1 8 .2 5 | 1 8 .1 2 |
| Ki ngswoo d House | High | 7 3 % | 1 1 .4 8 | 1 8 .0 5 | 1 8 .6 7 |
| Knollmead Primary | Very High | 8 2 % | 1 2 .0 2 | 1 8 .6 6 | 2 1 .3 4 |
| Linden Bridge | Very High | 8 3 % | 1 2 .1 5 | 1 8 .8 2 | 2 1 .6 0 |
| Malden Parochial | Very High | 8 8 % | 1 2 .2 1 | 1 9 .1 1 | 2 4 .9 6 |
| Mead Infant | Very High | 8 2 % | 1 2 .2 3 | 1 8 .8 9 | 2 0 .1 8 |
| Meadow Primary | Very High | 8 0 % | 1 2 .0 6 | 1 8 .7 3 | 1 9 .8 1 |
| Nescot | High | 7 2 % | 1 1 .4 2 | 1 8 .0 2 | 1 8 .4 0 |
| Nonsuch Primary | Very High | 8 1 % | 1 2 .0 5 | 1 8 .7 7 | 2 0 .4 0 |
| Riverview Primary | Very High | 8 1 % | 1 2 .1 7 | 1 8 .7 9 | 2 0 .2 9 |
| Rosebery | High | 6 7 % | 1 1 .2 9 | 1 7 .7 6 | 1 6 .7 5 |
| Shawley Community | Significant | 5 0 % | 1 0 .3 8 | 1 6 .7 9 | 1 4 .9 8 |
| Southfield Park | High | 7 2 % | 1 1 .5 4 | 1 8 .0 7 | 1 8 .1 0 |
| St Christophers | High | 7 0 % | 1 1 .4 2 | 1 7 .9 7 | 1 7 .6 6 |
| St Clements | High | 7 9 % | 1 1 .9 4 | 1 8 .5 9 | 1 9 .7 0 |
| St Josephs | High | 6 8 % | 1 1 .3 8 | 1 7 .8 6 | 1 6 .9 1 |
| St Martins | High | 6 8 % | 1 1 .3 1 | 1 7 .8 2 | 1 7 .0 6 |
| Stamford Green | High | 6 8 % | 1 1 .3 3 | 1 7 .8 0 | 1 7 .1 4 |
| Wallace Fields | High | 6 7 % | 1 1 .2 4 | 1 7 .7 5 | 1 7 .2 2 |
| West Ewell | Very High | 8 1 % | 1 2 .1 5 | 1 8 .7 8 | 2 0 .1 8 |
Image: The school run © Robert Ashby cc-by-sa/2.0 Geograph Ireland